-
Market Structure/Market Psychology & History
The 18th-Century Rice Trader Who Invented the Candlestick Chart
2026. 8. 11.
Table
반응형Every red and green candlestick chart used across global markets today traces back to a single 18th-century Japanese rice merchant who built a manual flag-signal network spanning 600 kilometers to get market information days ahead of his competitors. His name was Homma Munehisa, and the trading principles he developed at Osaka's Dojima Rice Exchange — the world's first futures market — remain in active use nearly 300 years later.
Table of Contents
- From Merchant's Son to Rice Market Legend
- Data-Driven Trading, a Century Before Computers
- An 18th-Century Information Network
- Reading Market Psychology Through Candlesticks
- The Sakata Five Methods
- Why Asian and Western Markets Use Opposite Colors
- Bottom Line
From Merchant's Son to Rice Market Legend
Homma Munehisa was born in 1724 into the wealthy Homma merchant family in Sakata, in Japan's Yamagata prefecture. Though the eldest son traditionally inherited the family business, Homma's father recognized his exceptional aptitude and named him heir at age 23, passing over the customary line of succession.
At the time, Japan was home to the Dojima Rice Exchange in Osaka, widely considered the world's first organized futures market. Rice functioned as currency in this era, and its price swung dramatically based on weather, harvest conditions, and rumor, making the Dojima exchange an intensely speculative trading venue.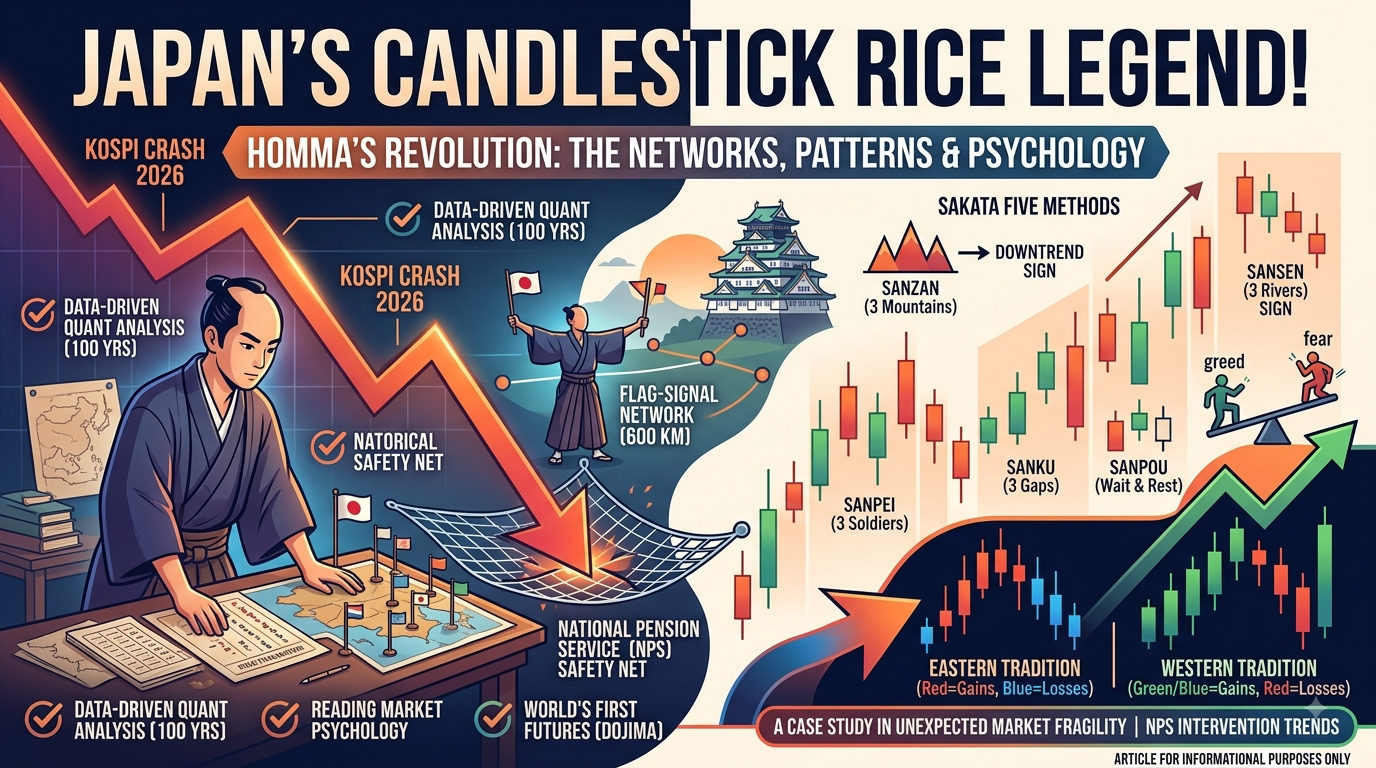 반응형
반응형Data-Driven Trading, a Century Before Computers
Rather than trading on instinct, Homma reportedly compiled and analyzed roughly a century's worth of historical data, including weather records, rice price movements, and harvest yields, to identify statistical patterns behind price behavior — an approach to quantitative analysis that predates modern data science by roughly 200 years.
An 18th-Century Information Network
Osaka sat roughly 600 kilometers from Sakata, meaning news could take days to travel between them under normal conditions. Homma addressed this by positioning relay signalers roughly every 6 kilometers along mountain peaks and rooftops between the two cities, using flag signals to transmit Osaka's rice prices back to Sakata in near real-time. This effectively gave him a multi-day informational advantage over other traders relying on standard information flow — a structural edge that made consistent losses nearly impossible.
Reading Market Psychology Through Candlesticks
Homma also recognized that rice prices weren't determined by supply and demand alone — human greed and fear played a substantial role in price formation. To visualize these emotional swings, he developed a charting method recording the opening, closing, high, and low prices for each trading period, creating what became the candlestick chart still used across global markets today.
The Sakata Five Methods
Homma's trading framework, known as the Sakata Five Methods (Sakata Gohou), consists of five pattern types still taught in technical analysis today:
- Sanzan (Three Mountains): Three consecutive price peaks at a chart's high point, where three failed attempts to break higher signal an impending downtrend — closely resembling the modern "head and shoulders" pattern.
- Sansen (Three Rivers): Three consecutive troughs at a chart's low point, where three failed attempts to break lower signal an impending uptrend — the equivalent of a modern "inverse head and shoulders" pattern.
- Sanpei (Three Soldiers): Three consecutive bullish (red) candles, signaling that strong buying momentum has taken hold and an uptrend is firmly underway, particularly powerful when it follows a Sansen formation.
- Sanku (Three Gaps): Three consecutive price gaps, interpreted as a warning sign that an existing trend is nearing exhaustion.
- Sanpou (Three Methods): The principle of stepping back and waiting during sideways, directionless markets rather than forcing trades.
Homma summarized his contrarian philosophy simply: "When everyone else is running west, I run east" — buying when the market was gripped by fear and selling when it was consumed by euphoria. This approach, combined with his informational and analytical edge, made him the wealthiest man in Edo-period Japan. A popular saying of the time captured his stature: "I may never become Homma, but I'd at least like to become a daimyo (feudal lord)" — reflecting that a merchant's reputation had come to exceed that of a regional ruler.
Why Asian and Western Markets Use Opposite Colors
Homma recorded rising prices in red ink and falling prices in black ink, a convention that became the template for candlestick charts across Asia. Red already carried associations with wealth and good fortune across Chinese-influenced cultures, making the color scheme culturally intuitive to adopt — which is why Korean and other Asian markets today still display rising prices in red and falling prices in blue.
Western markets adopted the opposite convention, showing gains in blue or green and losses in red, rooted in Western accounting practice, where profits were traditionally recorded in black ink and losses in red ink — the origin of the phrase "in the red" to describe financial losses.Bottom Line
Homma Munehisa's combination of century-spanning historical data analysis, a purpose-built long-distance information network, and systematic study of market psychology made him Edo-period Japan's wealthiest man, and left a lasting legacy still visible today in the candlestick chart and the red-versus-blue color conventions that split along East-West lines depending on centuries-old ink traditions.
This article is for informational purposes only and does not constitute investment, tax, or legal advice. Historical details are based on commonly cited accounts of Homma Munehisa's life and trading career. Readers should consult a licensed professional before making investment decisions.
반응형'Market Structure > Market Psychology & History' 카테고리의 다른 글
The 1997 Asian Financial Crisis: How a Currency Peg Became a Target (0) 2026.08.26 SK Hynix's Nasdaq Debut and the Psychology of the Korea Discount (0) 2026.08.26 What a Failed 2008 Forecast Teaches Us About Market Panic (0) 2026.08.08
Korean Stock & Equity Research
Data-driven analysis of Korean listed companies, combining financial fundamentals with supply chain and operations insights. Not investment advice.