-
Korean Equities/Dividend & Value-up
Why Foreign Investors Keep Selling Korean Stocks Despite Strong Returns
2026. 8. 10.
Table
반응형Korea's KOSPI has posted a notably strong nominal return this year, yet foreign institutional investors have been steady net sellers. The explanation isn't really about direction — it's about two risk metrics almost every large institution is quietly bound by: Value at Risk (VaR) and the Sharpe ratio. Understanding how these work explains a pattern that pure price-return analysis misses entirely.
Table of Contents
- Where VaR Came From
- How VaR Works
- cVaR: What VaR Doesn't Tell You
- VaR Limits as a Risk Budget
- What VKOSPI Shows in 2026
- The Sharpe Ratio: Rewarding Smooth Rides, Not Just Fast Ones
- How Single-Stock Leveraged ETFs Add Fuel
- Bottom Line
Where VaR Came From
In the late 1980s, JP Morgan's chairman reportedly asked for a single-page summary of the firm's total risk exposure, delivered every day 15 minutes after market close. The methodology JP Morgan's team developed to answer that request became Value at Risk (VaR), which the firm published freely in 1994, turning it into an industry standard used across institutional finance today.
VaR, Sharpe Ratios, and the Hidden Math Behind Korea's Foreign Selling 반응형How VaR Works
VaR functions much like a weather forecast: it states a time horizon, a confidence level, and a potential loss amount — for example, "1-day 95% VaR = 250 billion Won" means that on roughly 1 out of every 20 trading days, losses could exceed 250 billion Won. Raising the confidence level to 99% might translate to "1-day 99% VaR = 350 billion Won," meaning losses exceeding that amount are expected on roughly 1 out of every 100 trading days.
VaR itself depends on portfolio size, a confidence-level coefficient, and volatility. For a 10 trillion Won portfolio with 1.5% daily volatility, 99% VaR is calculated as 2.33 (the 99% confidence coefficient) multiplied by 1.5% multiplied by 10 trillion Won, yielding roughly 350 billion Won. The key takeaway is that volatility feeds directly into the VaR calculation — higher volatility mechanically produces a higher VaR figure for the same portfolio.
cVaR: What VaR Doesn't Tell You
VaR has a well-known limitation: knowing there's a 1% chance of losing more than 350 billion Won doesn't tell you how much more. Conditional VaR (cVaR) addresses this by averaging the actual losses that occur beyond the VaR threshold. If five separate days exceeded the 350 billion Won threshold with losses of 500 billion, 600 billion, 2 trillion, 400 billion, and 500 billion Won, the average of those five outcomes — roughly 800 billion Won — becomes the cVaR figure. The gap between VaR (350 billion) and cVaR (800 billion) in this example is driven almost entirely by the single 2 trillion Won tail event. In weather-forecast terms, VaR tells you there's a chance of a fever above 38.5°C; cVaR tells you that when it happens, the average temperature is actually 40°C.
VaR Limits as a Risk Budget
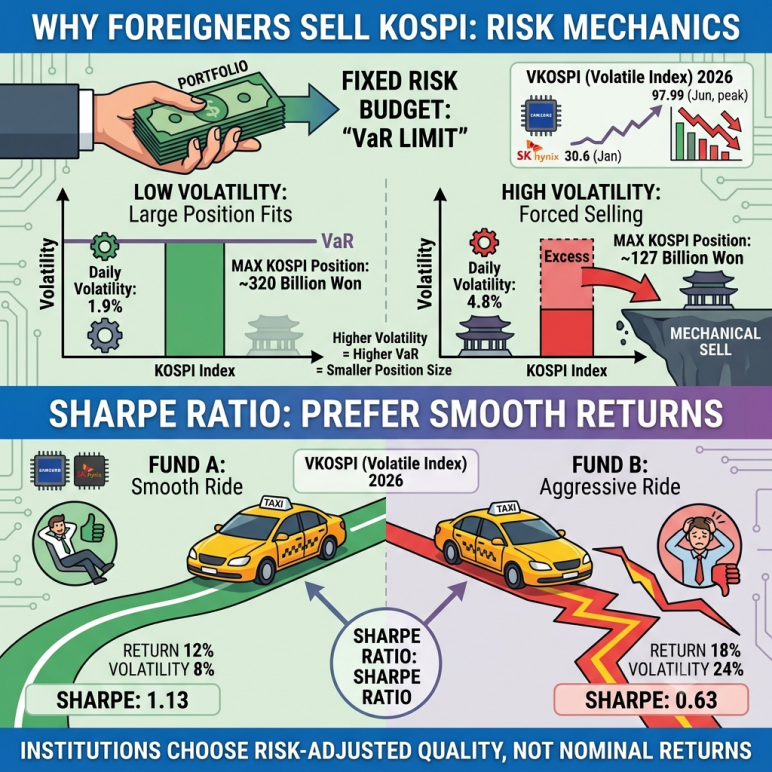
Global institutional investors, including pension funds, typically operate under a VaR limit — a fixed risk budget assigned to each portfolio manager, similar to an airline's baggage weight limit. Just as increased item weight forces a traveler to pack fewer items to stay under a fixed baggage allowance, increased asset volatility forces a portfolio manager to hold a smaller position to stay under a fixed VaR limit — not because the position lost merit, but purely to stay within the risk budget.
The math works in reverse from the VaR formula: maximum position size equals the risk budget divided by (volatility × confidence coefficient). With a 100 billion Won risk budget, 95% confidence (coefficient 1.645), and 1.9% daily KOSPI volatility, the maximum KOSPI position works out to roughly 320 billion Won. If daily volatility jumps to 4.8%, the same 100 billion Won risk budget only supports a position of roughly 127 billion Won — forcing the sale of roughly 193 billion Won in holdings purely as a function of rising volatility, independent of any change in the manager's actual market view.
What VKOSPI Shows in 2026
Date VKOSPI Level Approximate Daily Volatility January 2, 2026 30.6 ~1.9% June 29, 2026 (peak, intraday) 97.99 ~5.9% (closing basis) Early August 2026 75–77 ~4.8% VKOSPI, Korea's KOSPI 200 volatility index, roughly tripled from 30.6 at the start of 2026 to a peak near 98 by late June — a level well above the 50 threshold generally considered "extreme fear" territory, and still elevated above that line as of early August. VKOSPI is quoted on an annualized basis; dividing by approximately 16 converts it to an approximate daily volatility figure. Notably, VKOSPI dropped from the 80s into the 70s after regulators raised the minimum deposit requirement for single-stock leveraged products from 10 million to 30 million Won on July 31, suggesting retail leverage activity was a meaningful contributor to the volatility spike. As an implied, forward-looking measure, VKOSPI is best used as a directional gauge rather than a precise figure.
The Sharpe Ratio: Rewarding Smooth Rides, Not Just Fast Ones
A useful analogy: two taxis both reach the same destination in exactly one hour, but one gets there through aggressive lane-changing and hard braking while the other drives a steady, predictable route. Both arrive at the same time (the same return), but passengers clearly prefer the smoother ride. The Sharpe ratio, developed by William Sharpe in a 1966 paper responding to the lack of a common performance yardstick during the US mutual fund boom of the 1960s, formalizes this preference: Sharpe ratio equals (return minus risk-free rate) divided by volatility.
Because volatility sits in the denominator, higher volatility mechanically lowers the Sharpe ratio even for an identical return. Consider Fund A with a 12% return and 8% volatility against Fund B with an 18% return and 24% volatility, assuming a 3% risk-free rate: Fund A's Sharpe ratio is (12−3)/8 = 1.13, while Fund B's is (18−3)/24 = 0.63 — meaning Fund A is considered the superior risk-adjusted performer despite Fund B's higher headline return. Applying similar logic to markets, a hypothetical KOSPI with 10% return and 30% volatility would produce a Sharpe ratio of 0.23, while a Nikkei with 8% return and 12% volatility would score 0.42 — meaning the lower-return, lower-volatility market can be viewed as objectively superior by risk-adjusted standards, even with a lower nominal return.
Institutional investors typically apply both metrics together: VaR sets the hard position-size limit, while Sharpe ratio (or similar risk-adjusted metrics) determines how fund managers are evaluated and compensated — meaning managers are incentivized to favor "lower but steadier" returns over "higher but volatile" ones, since both metrics penalize volatility.
How Single-Stock Leveraged ETFs Add Fuel
Single-stock leveraged products tracking Samsung Electronics and SK Hynix, launched May 27, 2026, must rebalance daily to maintain 2x exposure to their underlying stock — buying more as prices rise and selling more as prices fall to maintain the leverage ratio. This mechanical rebalancing amplifies underlying volatility. Because Samsung Electronics and SK Hynix together represent roughly a third of total KOSPI market capitalization, volatility in these two names has an outsized effect on overall KOSPI volatility — feeding directly back into both the VaR calculations and Sharpe ratios institutional investors use to size and evaluate their Korean equity positions.
Bottom Line
For institutional investors managing fixed VaR risk budgets and evaluated on risk-adjusted metrics like the Sharpe ratio, rising volatility mechanically forces smaller position sizes and makes a market look less attractive — regardless of its headline return. With VKOSPI roughly tripling from January to its June peak, partly amplified by daily-rebalancing single-stock leveraged products concentrated in KOSPI's two largest constituents, this mechanical dynamic offers a structural explanation for sustained foreign selling of Korean equities that pure price-return analysis alone would miss.
This article is for informational purposes only and does not constitute investment, tax, or legal advice. Formula examples are illustrative and simplified for explanatory purposes. Readers should consult a licensed professional before making investment decisions.
반응형'Korean Equities > Dividend & Value-up' 카테고리의 다른 글
Korean Stock & Equity Research
Data-driven analysis of Korean listed companies, combining financial fundamentals with supply chain and operations insights. Not investment advice.